Applications
Relative conditional formatting in Excel 2007
Tue, 20/07/2010 - 8:23am — jethroI had a reader request some help with Conditional Formatting in Excel 2007.
Hi
Baffled in trying to get to grips with conditional formating in 2007
Scenario :
Column A = Actual Result
Column B = Target
Column C = Needs to show
1) If Actual result is less than 90% of target turn font colour RED
2) If Actual result is >90% of target and is <100% of target turn font colour AMBER
3) If Actual result is >= 100% of target turn font colour GREENIf column C meets criteria 1 use character "R", criteria 2 = "A" and criteria 3 = "G"
I can acheive 1 and 3 with =IF(a1b1,"G")) and then conditional format so that if contents of cell = R or G then colour font accordingly </B1,"R",IF(A1>
I`m stumped with the % factor and also think there might be a better way of doing it
Any help would be appreciated :)
Here is a solution to this problem.
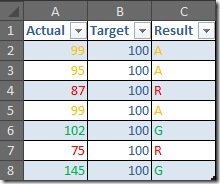
We formatted two columns to give two examples as to how it could be done.
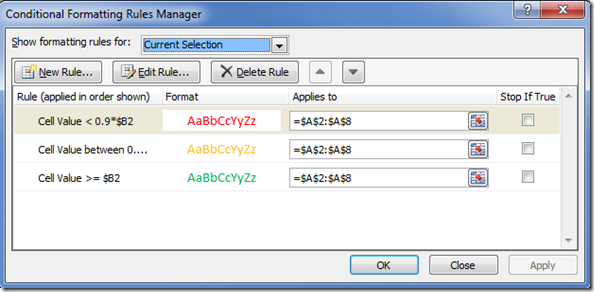
The actual column determines the percentage as part of the conditional format and formats in that way.
The result column formats on the “R”, “A”, and “G”.
 The formula in Column C1 is =IF(A2/B2<1,IF(A2/B2<0.9,"R","A"),"G") and this can be copied down.
Here are the rules for Column A
Office 2010 and the World Cup
Wed, 23/06/2010 - 8:05am — jethroI got this in an email from Microsoft today – © 2010 Microsoft Corporation.
Microsoft Office 2010 has been officially released. This latest version offers flexible and powerful new ways to deliver your best work—at the office, at home, or at school.
With Microsoft Office Home and Student 2010 you get four great tools for family projects and schoolwork: Microsoft Word 2010, Excel 2010, PowerPoint 2010, and OneNote 2010 — all with new features! Buy it now.How to articles, tips and more
Download: Keep track of the World Cup with this template
Having trouble keeping track of your favorite team in the World Cup? Use this handy Excel template to follow all the standings in the 2010 World Cup.
Excel 2010 - some of the major advantages over 2003 or 2007
Tue, 01/06/2010 - 4:33pm — jethroThe Ribbon and Backstage
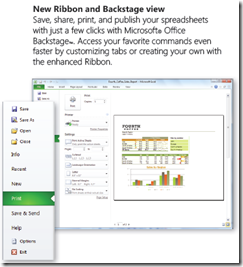
 Ok not everybody's favourite feature first time they switch from Office 2003. It does take some getting used to – and I still use keyboard short cuts for things. However the contextually sensitive ribbon has some major advantages over the old system. I honestly prefer the ribbon now especially in Microsoft Excel and Microsoft Word. In Office 2010 the ribbon can also be personalised.
The backstage view (access from the File menu now places in one easy place all file management tasks such as save, share and print. All the similar commands are grouped together. No more going to 3-4 different places to set print settings for an excel file.
Here's the best way to think about the Ribbon and Backstage.
- The Ribbon is for everything you want to do in a document – insert stuff, format stuff, change stuff.
- The Backstage area is for everything you want to do with a document – print it, save it , share it etc.
Sparklines and Pivot Tables
If you thought pivot tables were cool ways to play with (analyse) data before than wait until you play with the sexy new pivot tables in Excel 2010.
And sparklines (inline in cell micro charts) are an excellent way of demonstrating trends in a small space. I can’t wait to start incorporating some of these features for some of our clients when they upgrade.
Check this pivot table taken from timesheet data. I added the pivot chart and sparklines in about 3 minutes flat.
Photography stuff - tools and reviews
Sun, 09/05/2010 - 9:08am — jethroSome of the cool things I have found lately that are photography related.
Tools
- Flickr Screensaver – this is awesome! can pull any users or group of users photos from flickr as a screensaver, by tags even! And it runs on multiple monitors. In my case all 6! Download Flickr .Net Screensaver free from CodePlex
- Producer for PowerPoint
Microsoft Producer for PowerPoint provides users with many powerful new features that make it easier to synchronize audio, video, slides, and images to create engaging and effective rich-media presentations. Producer gives content and media professionals, as well as everyday PowerPoint users a host of new content authoring features.
- Compfight – a flickr searching tool – excellent for finding photos for use in blog posts. Its where I found the picture in this article of the tools.


Recent comments
10 years 37 weeks ago
10 years 37 weeks ago
10 years 39 weeks ago
10 years 39 weeks ago
10 years 39 weeks ago
10 years 39 weeks ago
10 years 39 weeks ago
10 years 39 weeks ago
10 years 39 weeks ago
10 years 39 weeks ago